Creative Technologist, Photographer
クリエイティブテクノロジスト、フォトグラファー

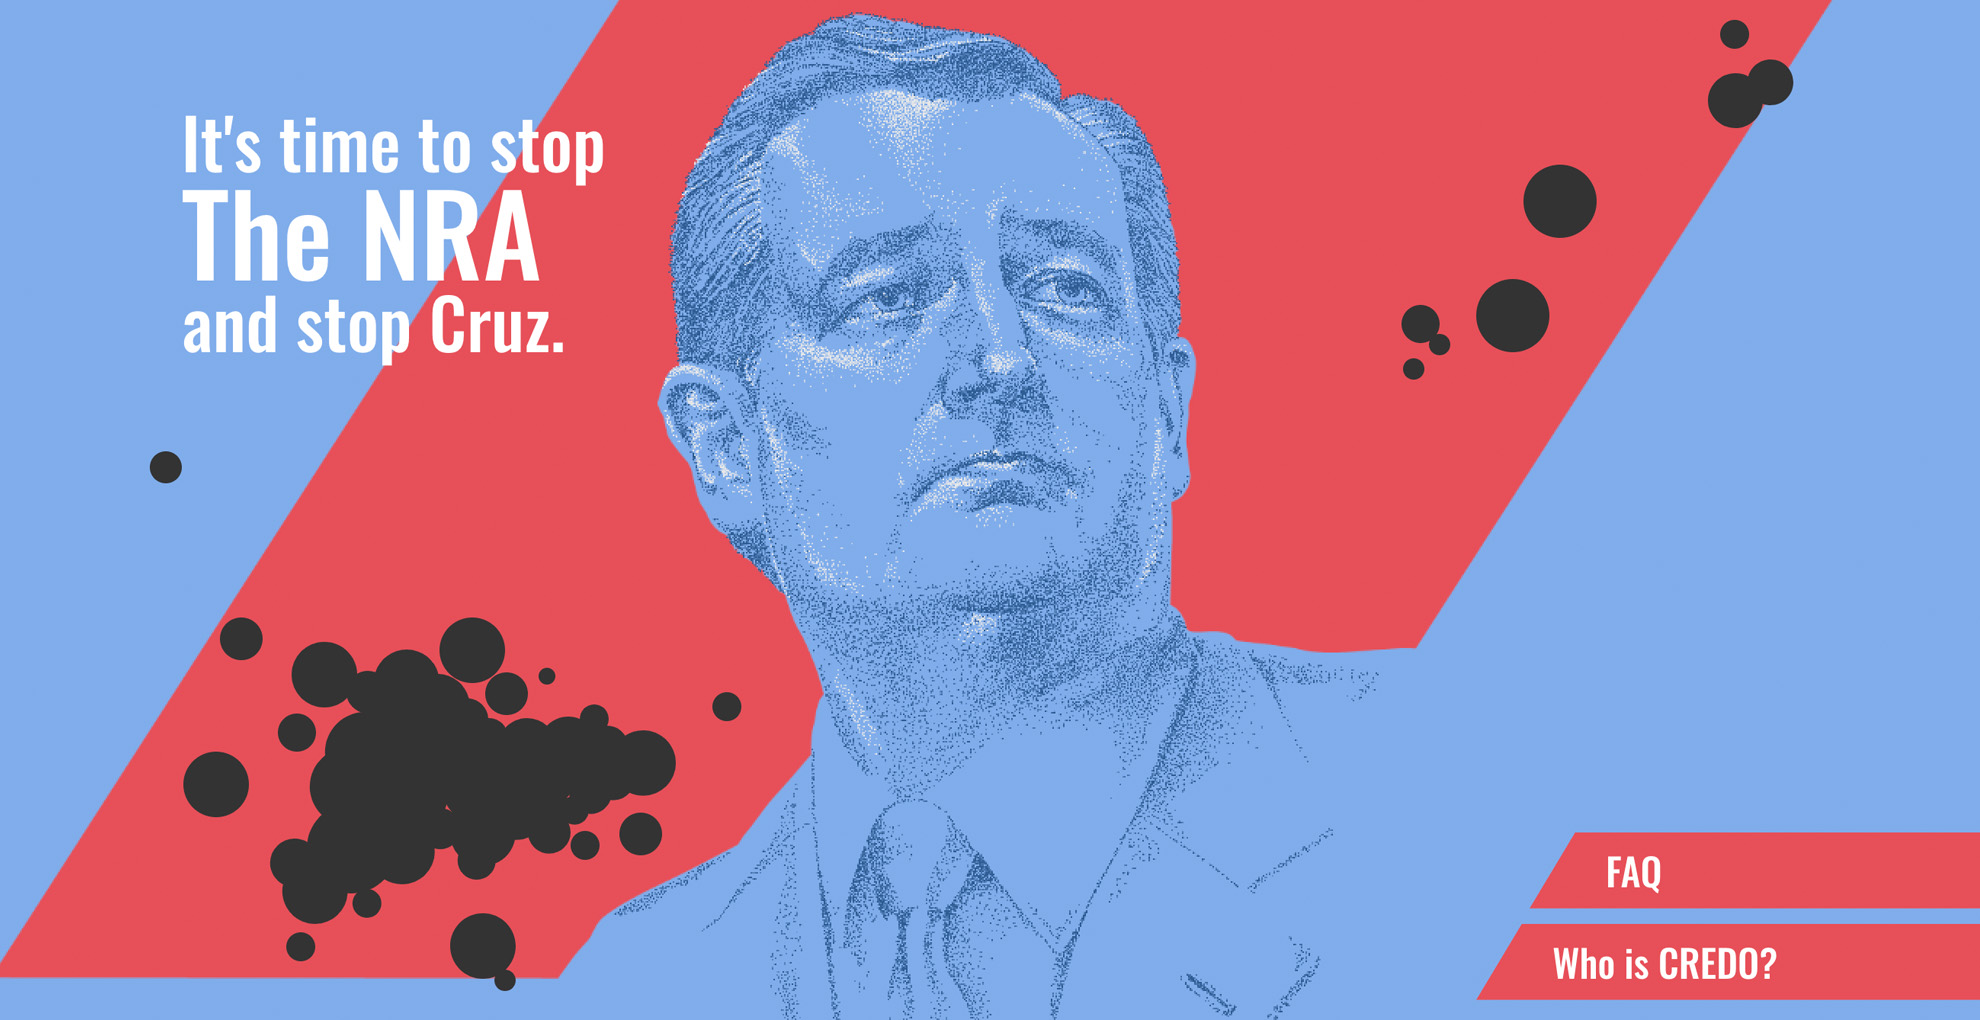
This time, a little more political. One of my co-workers, Timothy Mattimore, approached me with an idea, he had created these art posters done in pointillism with a deep symbolic meaning behind them. They portrayed the head of the NRA and some members of congress that take their money, and each and every dot used was representative of an act of gun violence in the USA, so far this year.
He wanted to take this project and give it some life and depth on the internet. So together we worked with GunViolenceArchive.org’s team to get real incident data for all 36,231 dots and I set to work on creating a website that would let you explore the meaning of these dots based on my partner’s art.
The website itself is pretty basic, but in order to load, render, and animate that many dots on a page was a challenge. I ended up using WebGL through Pixi.js to place and control each dot, then to move the dots and animate other elements I used GreenSock JS, as not much else was able to handle motion with this level of data. The WebGL script uses to just coordinate data to draw each dot, then when called upon, the dot fires an AJAX request to a simple backend API I created to pull the actual incident’s data along with a link to the full details on the Gun Violence Archive’s database.
Our work on this project won us a few awards with the Art Directors Club and CreativePool Awards. If you would like to read on my partner’s inspiration and the other parts of this project, you can here. http://www.timmattimore.com/#/new-page-4/